Are Fibonacci retracements real market phenomena or just a self-fulfilling prophecy that works because everyone believes they work? After seeing the same debate on trading forums for the third time, I decided to actually test it. I tracked 50 swing trades using Fibonacci retracement levels as my primary entry tool. Here's what the data showed — and what changed about how I use them.
What Are Fibonacci Retracements?
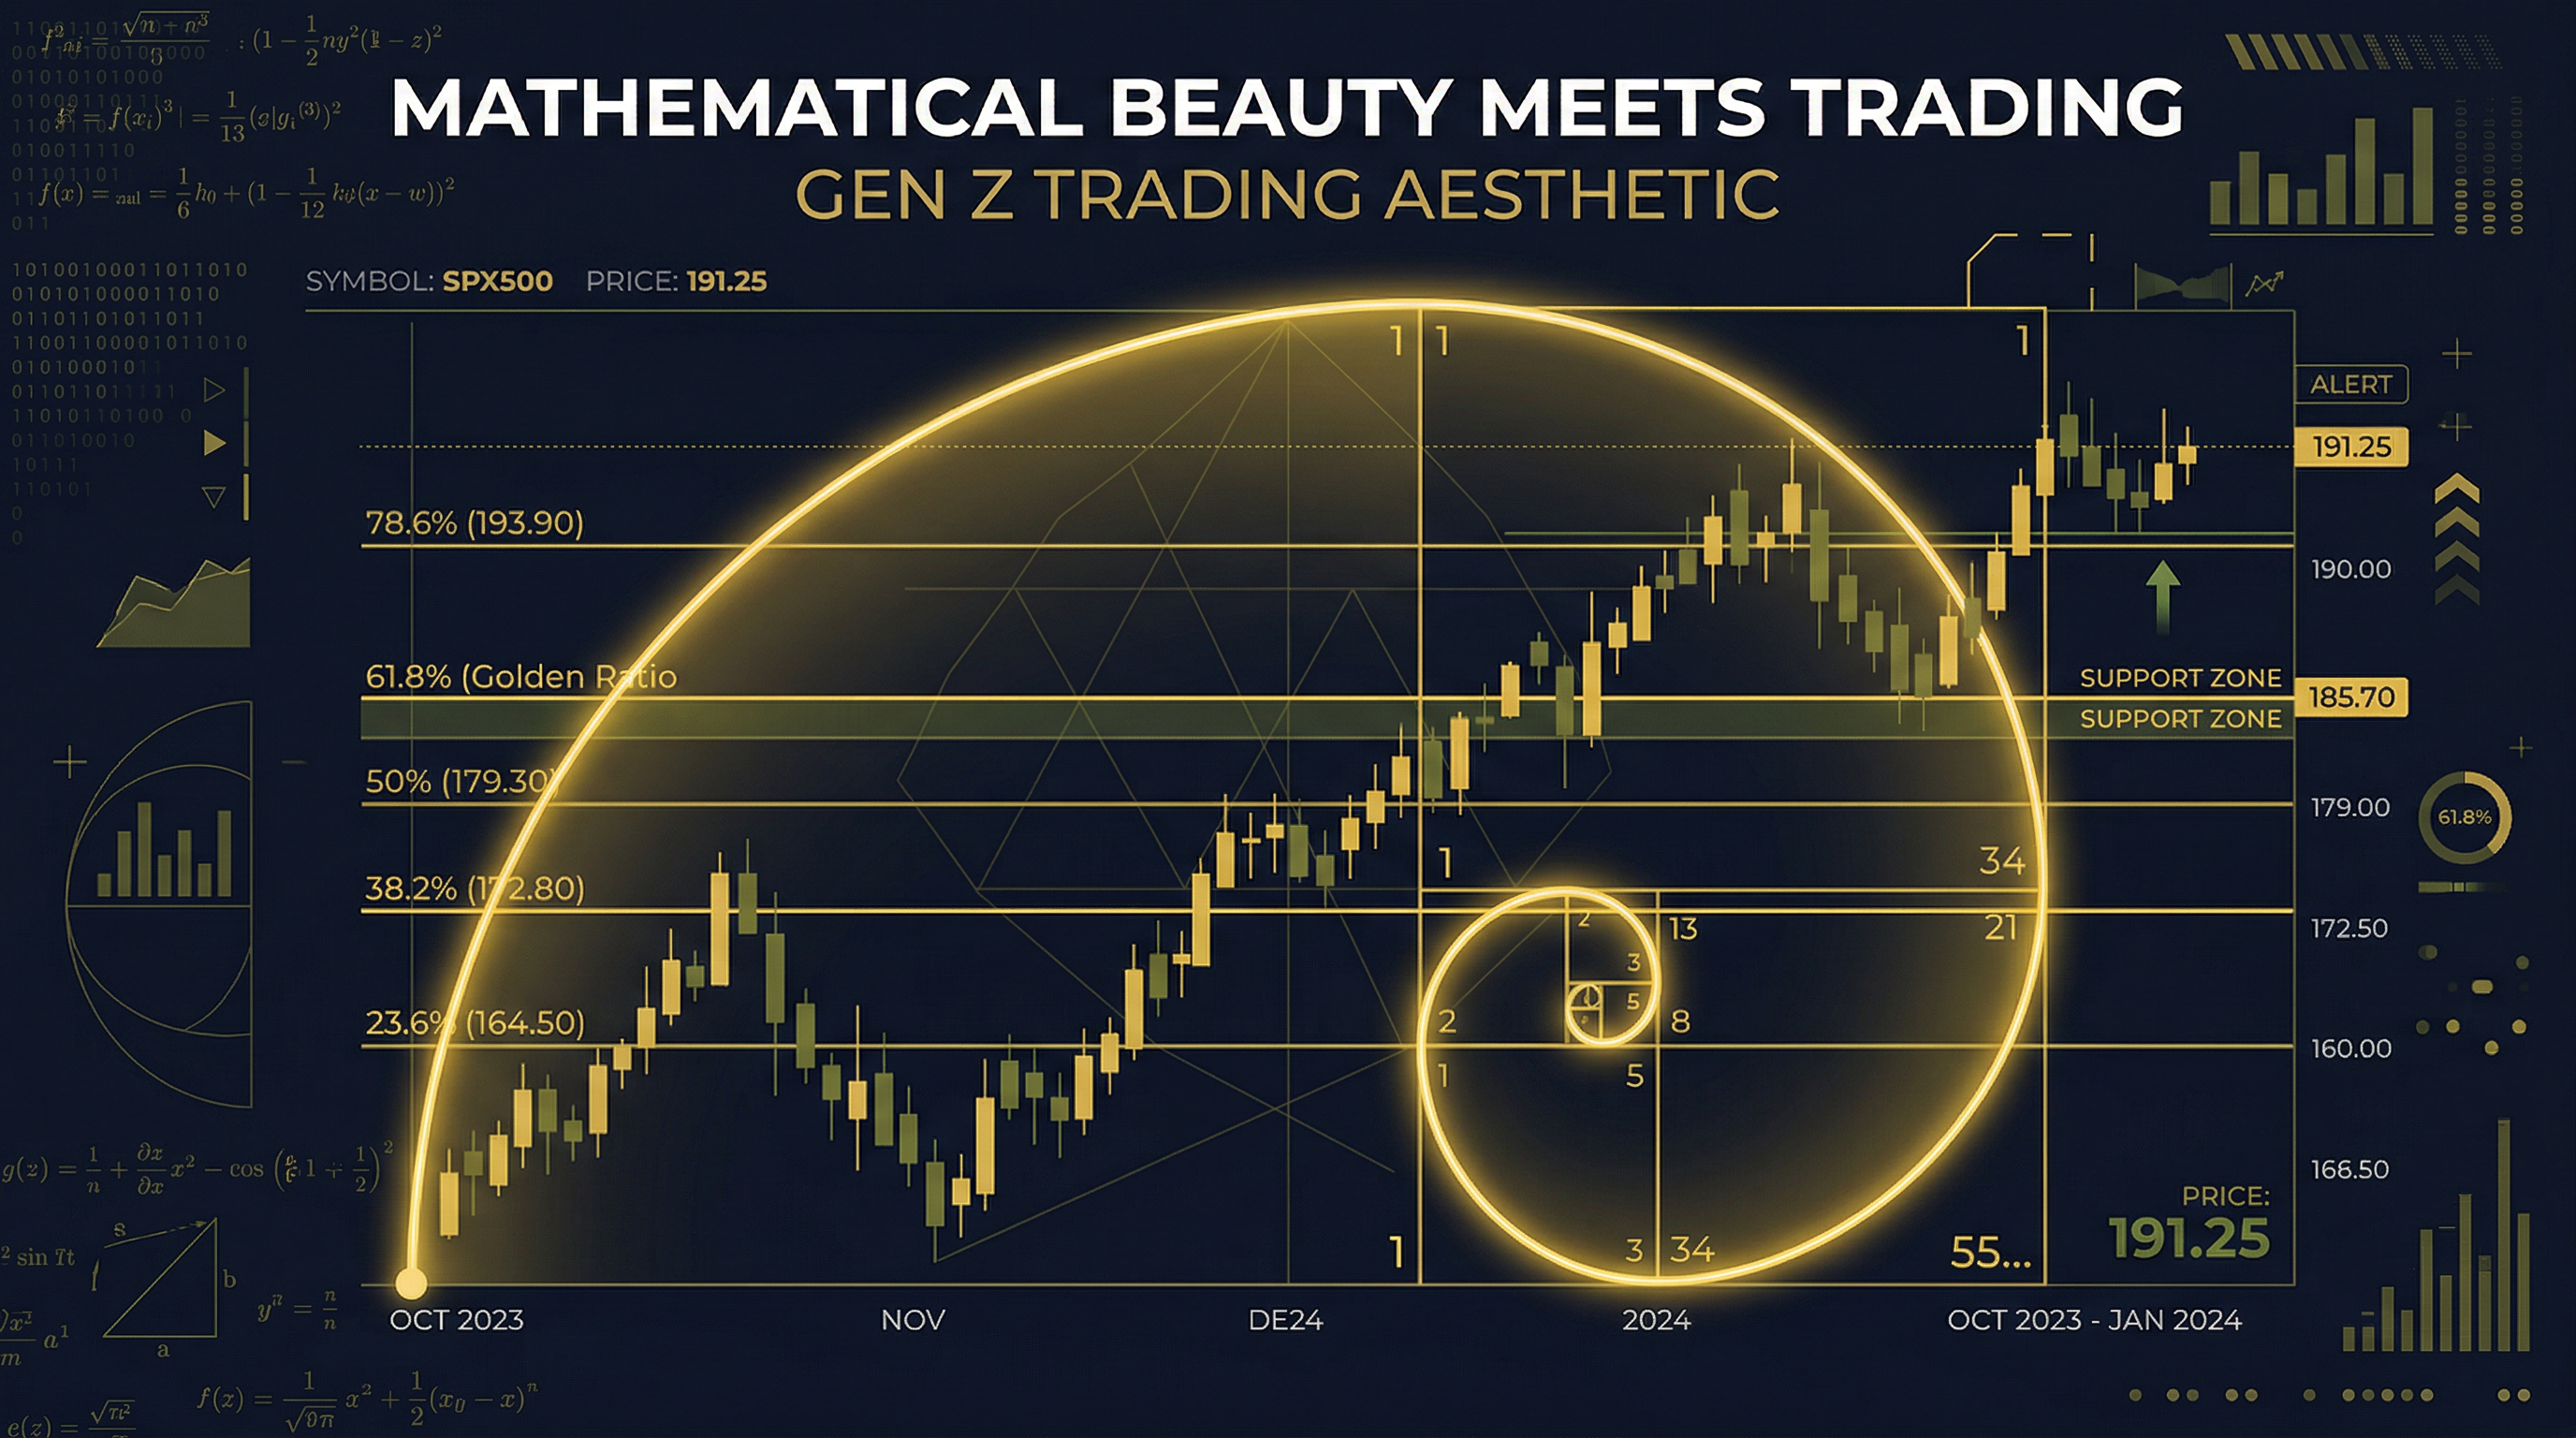
The Fibonacci sequence (0, 1, 1, 2, 3, 5, 8, 13, 21...) generates ratios that appear throughout nature and, supposedly, financial markets. The key retracement levels traders use are derived from these ratios: 23.6%, 38.2%, 50%, 61.8%, and 78.6%.
To draw Fibonacci retracements on a chart, you identify a significant swing high and swing low. The tool then automatically draws horizontal lines at each key percentage level between those two points. The idea: when a stock pulls back from a rally, it often "retraces" to one of these levels before resuming its trend.
Why These Specific Percentages?
The 61.8% level is the "golden ratio" (phi) — divide any Fibonacci number by the one after it and you approach 1.618. Its inverse, 0.618, appears in everything from seashell spirals to flower petal arrangements. The 38.2% level is 1 minus 0.618. The 50% level isn't technically a Fibonacci ratio but is widely used as the midpoint of any major move.
My 50-Trade Fibonacci Test: Methodology and Results
I paper traded 50 swing trade entries on Traderise's simulator using Fibonacci retracement levels as the primary trigger. The rules: enter when price pulls back to a key Fib level in a confirmed uptrend, confirmed by RSI showing oversold conditions or a candlestick reversal pattern. Stop just below the next Fibonacci level down. Target: previous swing high.
The Results (Honest)
Of 50 trades:
- 38.2% level: 12 trades, 7 winners (58% win rate)
- 50% level: 16 trades, 10 winners (63% win rate)
- 61.8% level: 14 trades, 9 winners (64% win rate)
- 78.6% level: 8 trades, 3 winners (38% win rate — too deep, trend often weakening)
The 50% and 61.8% levels performed best. The 78.6% level was weaker — by the time a stock retraces that deep, the trend may be losing integrity.
Fibonacci levels work best as zones, not exact prices, and always need confirmation from at least one other signal (RSI oversold, candlestick reversal, volume spike). Trading a Fibonacci level alone without confirmation is lower probability. Combine them for stronger setups — practice this combination on Traderise before going live.
How to Draw Fibonacci Retracements Correctly
Step 1: Identify the Swing High and Low
For a pullback entry in an uptrend: your swing low is where the trend started (the base of the move), and your swing high is the most recent peak before the pullback. Drag the Fibonacci tool from the swing low to the swing high. The levels will automatically populate between those two points.
Step 2: Don't Over-Extend to Minor Swings
The most common beginner mistake: drawing Fibonacci on tiny price moves instead of significant swings. A Fibonacci drawn on a 2% move is meaningless — the levels are so close together they're useless. Minimum: use significant swings of at least 10–15% for meaningful retracement zones.
Step 3: Look for "Confluence" — Multiple S/R at Same Level
Fibonacci levels become much more powerful when they align with other technical factors. A 61.8% retracement level that also coincides with the 50-day moving average and a previous support level is a high-probability zone. The more independently arrived-at signals pointing to the same price level, the stronger that level is likely to be.
Practice This Strategy Risk-Free
Traderise lets you paper trade with $10,000 in virtual funds using real market data. Test every strategy in this article before you risk a single real dollar.
Start Paper Trading FreeThe Best Fibonacci Setups in Practice
The Deep Pullback Entry (38.2%–50% Zone)
Stock rallies strongly from $40 to $60 (a 50% gain). It then pulls back. You draw Fibonacci from $40 to $60. The 38.2% level lands at $53.44, the 50% level at $50. You watch for price to slow its decline and show reversal signals as it approaches $53–$50. Enter on the first strong green candle after a clear bounce with increasing volume. Stop just below $50.
The Golden Ratio Bounce (61.8%)
Stock rallies from $100 to $160. Pulls back to $122.80 (the 61.8% retracement of the $60 move). RSI reaches 38. A hammer candlestick forms at $122.50. You enter the next day when price moves above the hammer high. Stop at $119. This is the "golden ratio bounce" setup and has historically been one of the most reliable Fibonacci entries.
Why Fibonacci Works (The Self-Fulfilling Argument)
The honest answer: Fibonacci retracements work largely because enough traders use them. When millions of traders have the 61.8% level drawn on their charts and are watching for a bounce there, their collective buying at that level creates the bounce. The math gives the levels legitimacy and adoption; adoption creates the actual price reaction.
This is actually a feature, not a bug. You don't need to believe in the mystical properties of the golden ratio to use Fibonacci effectively — you just need to know that many institutional and retail traders are watching the same levels and will act at them. That collective behavior creates tradeable price reactions regardless of why the levels work.
Whether you believe in the math or the psychology, the practical result is the same: these levels are worth knowing, worth watching, and worth trading when you have confirmation. Start practicing with them on Traderise's paper trading platform to build your intuition for when they're working and when they're not.
Test Fibonacci Setups Risk-Free
Draw Fibonacci levels on real charts and paper trade the bounce setups on Traderise — with real market data and $10,000 in virtual capital. Build your edge before going live.
Try Traderise Free