If there's one indicator that shows up on virtually every professional trader's chart, it's the moving average. Not because it's magic — because it does one essential job incredibly well: it cuts through the daily noise and shows you the actual trend of a stock. The debate about which type to use (SMA vs. EMA) seems minor until you realize it's making you buy too late or get stopped out prematurely. Let me break down exactly what each one does and when to use which.
What Is a Moving Average and Why Should You Care
A moving average smooths out price data by calculating the average price over a specific number of past periods. A 20-day moving average calculates the average closing price of the last 20 trading days, updated daily as new data comes in. As prices change, the line "moves" — hence the name.
Moving averages serve three core functions for traders:
- Trend identification: Is price above or below the MA? Above = bullish, below = bearish.
- Dynamic support/resistance: In trending markets, price often bounces off key MAs.
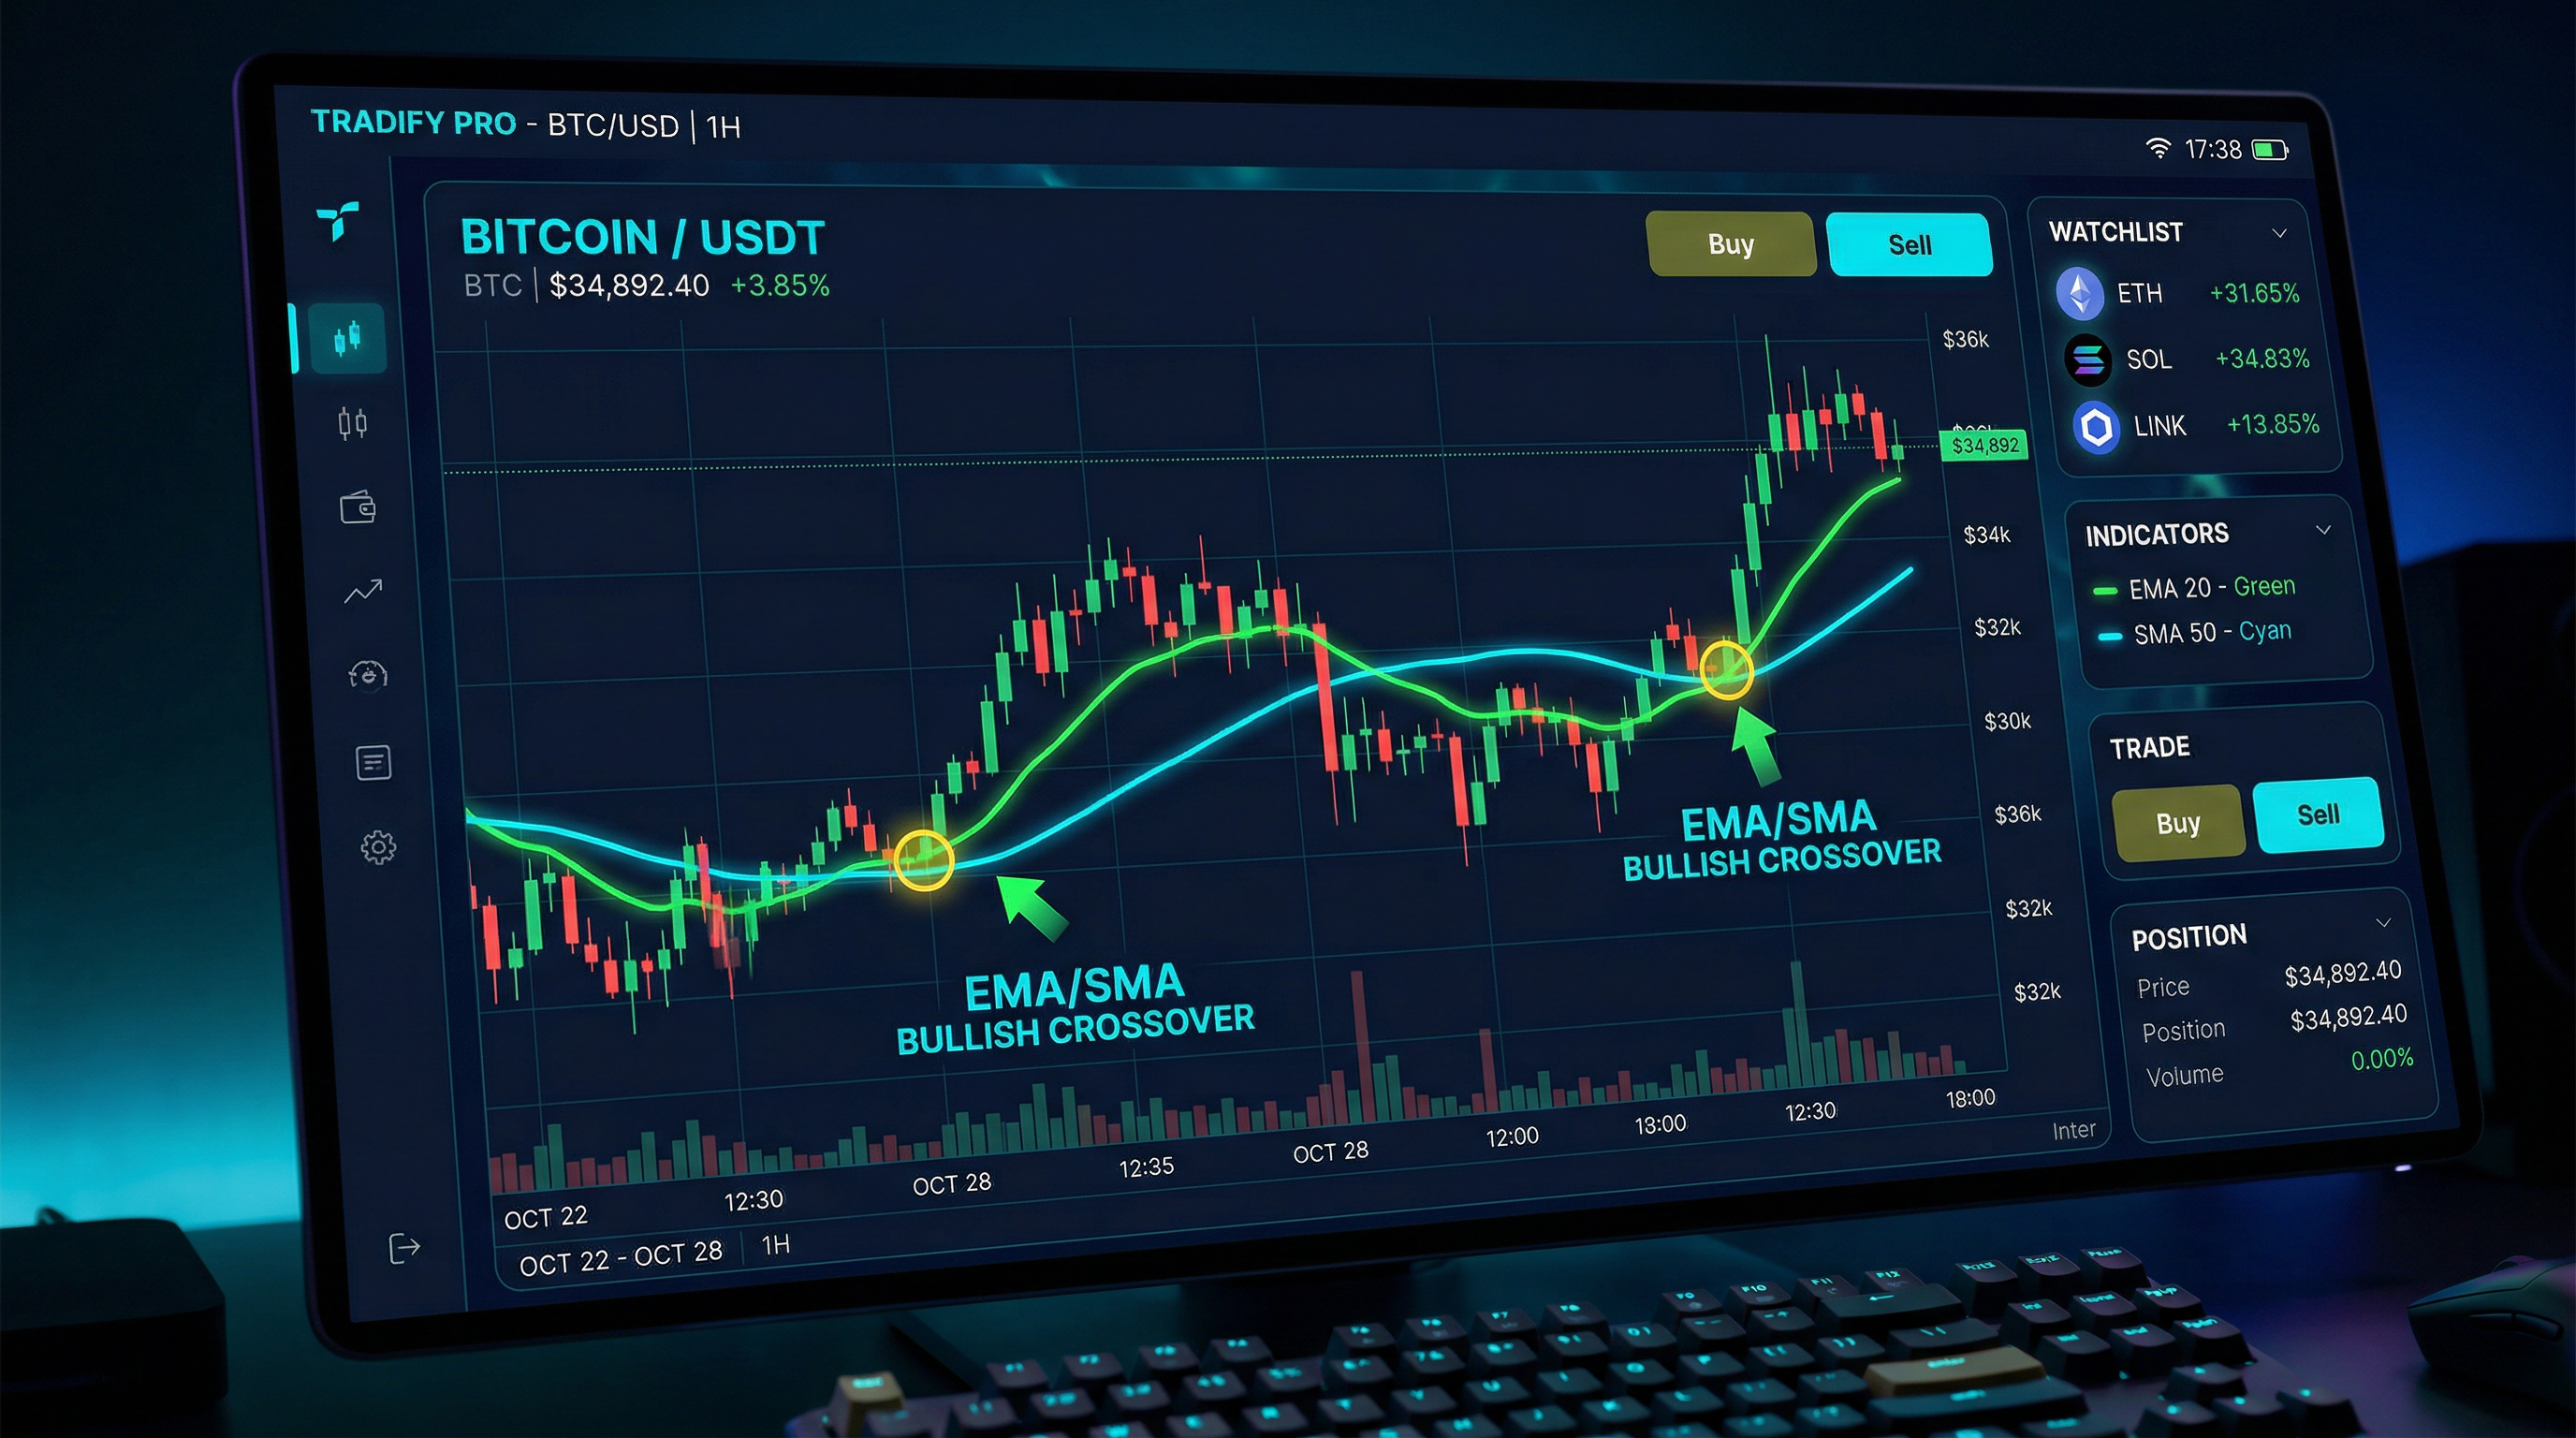
- Crossover signals: When a shorter MA crosses above a longer MA, it can signal a trend change.
The Most Common Moving Average Periods
You'll see these periods used most frequently: 9-period (very short-term, day traders), 20-period (short-term trend, swing traders), 50-period (intermediate trend, position traders), 200-period (long-term trend, investors). Each tells a different story about a stock's momentum.
Simple Moving Average (SMA): The Classic
The SMA gives equal weight to every data point in its lookback period. A 20-day SMA averages the past 20 closing prices and treats day 1 and day 20 as equally important. It's stable, smooth, and easy to interpret.
When SMA Works Best
SMA is better for identifying broader, longer-term trends where you want to reduce noise. The 50-day and 200-day SMAs are widely followed by institutional investors — which is important because the levels where institutions act have real market impact. When the S&P 500 crosses the 200-day SMA, it makes news. That widespread attention makes these levels more powerful as support/resistance.
SMA is also better for choppy, non-trending markets because its smoother line produces fewer false signals.
SMA's Weakness
Because it weights all periods equally, the SMA can be "fooled" by a sharp price move from 20 days ago dropping out of the calculation. When that old outlier falls off, the MA line can jump or dip without any recent price change — a ghost effect that can confuse your analysis.
Exponential Moving Average (EMA): The Responsive One
The EMA gives more weight to recent prices. In a 20-day EMA, yesterday's close matters more than the close from 20 days ago. This makes the EMA more reactive to recent price action — it moves faster and hugs price more closely than the SMA.
When EMA Works Best
EMA is better for faster-moving strategies where you need more responsive signals. Day traders and swing traders typically prefer the 9-EMA and 20-EMA for short-term signals. The 20-EMA is particularly popular as a dynamic support level for stocks in strong uptrends — it often provides bounce opportunities that the SMA misses because it's too slow to react.
In fast-moving market conditions (like AI stock momentum in 2026), EMAs are generally more useful than SMAs for capturing entries without giving back too much of a move waiting for a signal.
EMA's Weakness
The EMA's responsiveness is also its problem in choppy markets. It reacts too quickly to every wiggle, generating false signals and whipsawing traders who try to trade every cross. In low-volatility, sideways markets, EMA crosses are mostly noise.
Use both: EMA for entries (it reacts faster to developing setups), SMA for trend context (the 50-day and 200-day SMAs are watched by institutions and define the bigger picture). Adding both types to your charts on Traderise gives you a clearer complete picture than using either one alone.
The Golden Cross and Death Cross: Overrated but Important to Know
The Golden Cross
When the 50-day MA crosses above the 200-day MA, it's called a Golden Cross — a historically bullish signal that has preceded major bull runs. When the S&P 500 formed a Golden Cross in early 2023, the market rallied significantly in the following months. It's not a "buy immediately" signal (it's lagging — the move has often already happened), but it confirms the longer-term trend has shifted positively.
The Death Cross
The opposite: 50-day crosses below the 200-day. Historically associated with continued downside or bear market conditions. The S&P 500's Death Cross in early 2022 preceded significant further losses. Again, lagging — but confirmation of trend is still useful.
Don't trade these crosses alone. Use them as trend context filters for your other strategies.
Practice This Strategy Risk-Free
Traderise lets you paper trade with $10,000 in virtual funds using real market data. Test every strategy in this article before you risk a single real dollar.
Start Paper Trading FreePractical Moving Average Strategies for Beginners
Strategy 1: The 20/50 EMA Trend Trade
Add the 20-EMA and 50-EMA to your chart. When the 20-EMA is above the 50-EMA and both are sloping upward, you're in an uptrend. Trade only long positions in this environment. Enter on pullbacks where price touches or briefly dips below the 20-EMA and then reverses back above. Stop goes below the 50-EMA. Target: most recent high.
Strategy 2: The 200 SMA Filter
Simple rule: only buy stocks trading above their 200-day SMA. This instantly removes all stocks in confirmed downtrends from your consideration. It's not a perfect filter, but it dramatically improves the base rate of your trades by ensuring you're always swimming with the broader current.
Strategy 3: MA as Trailing Stop
For swing trades you want to hold as long as possible, use the 20-day EMA as a trailing stop. When price closes decisively below the 20-EMA (not just a brief wick — a real close), exit the trade. This lets you ride strong trends for weeks while still getting out when momentum fades.
The Settings That Actually Matter (And the Ones People Overthink)
New traders spend a lot of time tweaking MA periods trying to find "magic" settings. 15-day vs 20-day vs 21-day. The difference is minimal. What matters much more is consistency — pick your settings and use them across all your analysis so you're comparing apples to apples.
A simple setup that works: 20-EMA and 50-EMA on daily charts for swing trading, 200-SMA for long-term trend context. Apply it consistently in Traderise, develop a feel for how price interacts with these levels, and resist the urge to constantly optimize. Consistency beats optimization for beginners every time.
Master Moving Averages on Real Charts
Add SMAs and EMAs to real stock charts on Traderise and practice the strategies in this article with virtual funds. See firsthand which type of moving average fits your trading style.
Try Traderise Free