I spent months learning chart patterns — head and shoulders, cup and handle, flags, wedges. All of it was confusing until one day someone explained support and resistance, and suddenly every single pattern made sense. They're all just variations of the same fundamental idea: price tends to stop, reverse, or hesitate at levels it's visited before.
Master support and resistance and you've mastered 70% of technical analysis. Here's the complete guide.
Support and Resistance: The Core Concept
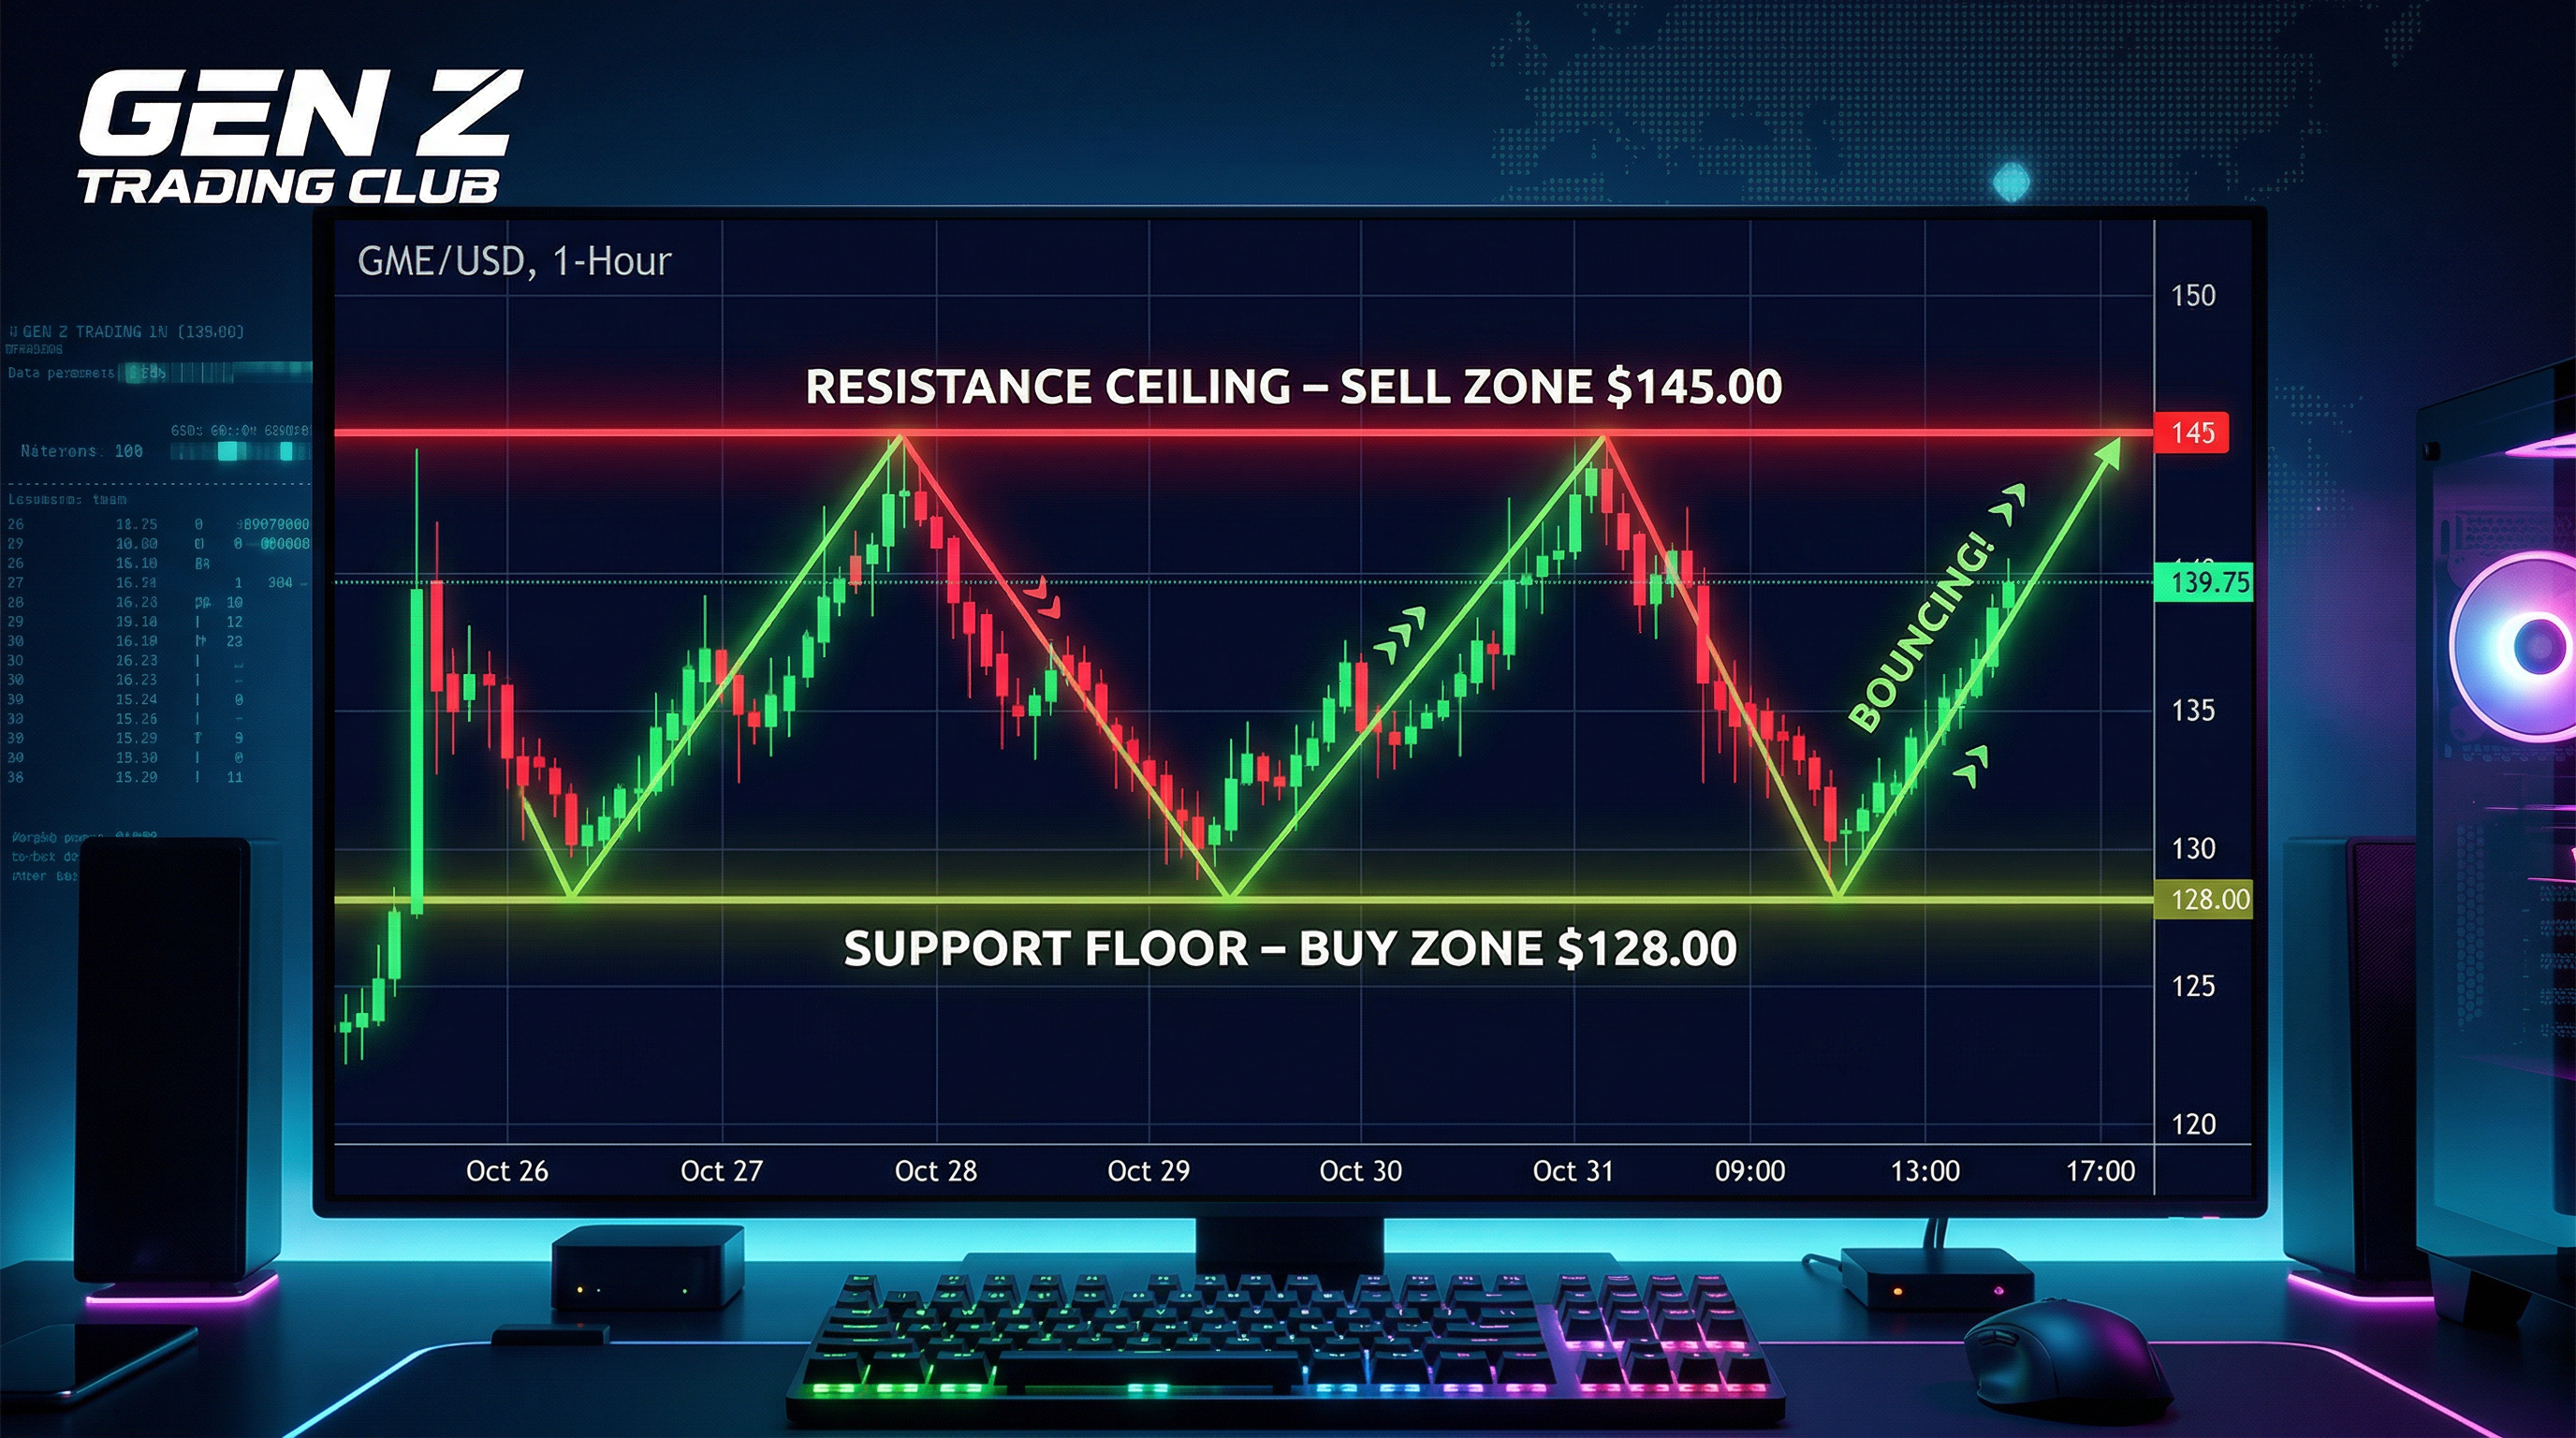
Support is a price level where buying pressure is strong enough to stop or reverse a downward move. Think of it as a floor. Sellers try to push the price down; buyers step in aggressively at this level and hold it up.
Resistance is the opposite — a price level where selling pressure stops or reverses upward moves. The ceiling. Buyers try to push price higher; sellers step in and cap the advance.
Why do these levels form? Because price has memory. When a stock fell from $80 to $60 and then reversed sharply at $60, investors remember that $60 was a great buying opportunity. Next time the stock approaches $60, those same investors (and new ones who noticed the chart) step in to buy again — creating a self-fulfilling support level.
The Psychology Behind the Levels
Support and resistance are fundamentally psychological phenomena. Three groups of traders create them:
Buyers who missed the move: "I should have bought at $60 when it bounced. If it comes back there, I'm definitely buying." → Creates buying pressure at support.
Sellers who bought at the top: "I bought at $80 and got killed. When it gets back to $80 I'm getting out breakeven." → Creates selling pressure at resistance.
Traders who were right: "I sold at $80, worked perfectly. I'll sell again there if it gets back." → Reinforces resistance at the same level.
How to Identify Support and Resistance on a Chart
Method 1: Previous Price Highs and Lows
The most straightforward support and resistance levels come from previous notable highs (potential resistance) and notable lows (potential support). These are the levels where price historically paused, reversed, or consolidated. Look for "pivot points" — clear turning points on the chart visible even at a glance. Using Traderise's charting tools, you can draw horizontal lines at these levels and track how price interacts with them over time.
Method 2: Round Numbers
Price tends to stall at round numbers ($50, $100, $200, $500). This is pure psychology — buyers and sellers consciously and unconsciously anchor to these levels. Apple at $200 "feels" like a milestone. Tesla at $300 generates news coverage. These levels attract both buyers (seeing them as targets) and sellers (taking profits at "nice" numbers).
Method 3: Moving Averages as Dynamic S/R
Moving averages (especially the 50-day and 200-day) act as dynamic support and resistance. In uptrending stocks, price frequently pulls back to the 50-day MA and bounces — the MA acts as moving support. When price breaks below the 200-day MA and struggles to reclaim it, the 200-day becomes resistance. These dynamic levels shift with price, making them more relevant than static horizontal lines in trending markets.
Support and resistance are zones, not exact prices. A stock "testing" $50 support might dip to $49.50 before reversing. Drawing your S/R lines too precisely causes you to get faked out of good trades. Think in ranges: the $48–$50 support zone, not "exactly $50." Practice identifying zones (not lines) on charts with real stocks via Traderise's paper trading platform.
The Role Reversal Principle: The Most Powerful Concept in Technical Analysis
Here's the concept that separates intermediate traders from beginners: when price breaks through a significant support level, that support often becomes new resistance. And vice versa — broken resistance becomes new support.
Why? The same psychology that created the original level now works in reverse. Buyers who bought at $60 support and held through a break below it are now trapped. When price rallies back to $60, they're relieved to get out at breakeven — their selling creates new resistance at the old support level.
Trading the Role Reversal
This creates one of the cleanest trade setups in technical analysis: the "throwback to broken resistance." A stock breaks above resistance at $100. Price rallies to $115. It then pulls back toward $100. You buy the retest of $100 (now support), with a stop just below it. You're buying the confirmation that the role reversal is holding.
Practice This Strategy Risk-Free
Traderise lets you paper trade with $10,000 in virtual funds using real market data. Test every strategy in this article before you risk a single real dollar.
Start Paper Trading FreeHow to Trade Support and Resistance: 3 Concrete Setups
Setup 1: Bounce at Support
Stock pulls back to a well-established support level. Volume decreases on the pullback (less selling pressure). Price begins to stabilize or form small reversal candles (hammers, doji). You buy the bounce with a stop just below support. Target: previous high or next resistance level above.
Key filter: only trade bounces at support in uptrending stocks. In a downtrend, support levels frequently break. Don't fight the trend.
Setup 2: Resistance Breakout
Stock has repeatedly tested resistance at $75 over several weeks. Each test shows declining selling pressure (volume getting lighter on the rejections). Finally, price breaks above $75 on significantly higher volume (1.5x–2x average). You buy the breakout, with a stop just below $75. Target: measure the height of the prior consolidation range and project it above the breakout.
Setup 3: The Failed Breakdown (Bull Trap Reversal)
Stock breaks below key support, triggers everyone's stops, then immediately reverses back above the support level. This failed breakdown traps short sellers who acted on the break. As they rush to cover, price rockets higher. Buy the close back above support. This is a higher-risk setup but extremely powerful when it occurs.
Common Mistakes When Using Support and Resistance
Drawing too many lines: If your chart has 15 horizontal lines, you've drawn too many. Focus on the 2–3 most significant levels — the ones where price has clearly responded multiple times.
Trading in weak overall market conditions: Even perfect support levels get broken in market-wide selloffs. Always check the S&P 500's direction before trading individual stock S/R levels.
Ignoring the context: A support test in a stock that just had a negative earnings report is very different from a support test in a fundamentally sound stock dipping due to broad market weakness.
Getting out too early: If a stock bounces from support and your target is the resistance level above, don't bail halfway. Trust your analysis and give the trade room to reach the objective.
The best way to internalize these concepts is to draw support and resistance on real charts and practice trading them — ideally on Traderise's paper trading platform where you can make mistakes without financial consequences.
Practice Support & Resistance Trading Risk-Free
Draw real support and resistance levels on live charts and practice trading the setups on Traderise — with $10,000 in virtual funds and real market data. Internalize these concepts before your portfolio depends on them.
Try Traderise Free