El RSI fue el primer indicador que añadí a un gráfico. Lo entendí mal de inmediato. Pensé que «sobrecomprado = vender» y «sobrevendido = comprar» eran reglas universales. Así que me puse corto en una acción tecnológica con el RSI en 78 porque claramente era «demasiado alto». Luego llegó al RSI 90 y la acción ganó otro 30%. Esa fue una lección costosa sobre cómo funciona realmente el RSI.
Aquí está la guía completa para que no cometas mis errores.
Qué Es el RSI y Cómo Se Calcula
RSI significa Índice de Fuerza Relativa (Relative Strength Index). Es un oscilador de momentum que mide la velocidad y magnitud de los cambios de precio recientes para evaluar si una acción está potencialmente sobrecomprada o sobrevendida. Fue desarrollado por J. Welles Wilder Jr. en 1978 y sigue siendo uno de los indicadores más utilizados en el análisis técnico.
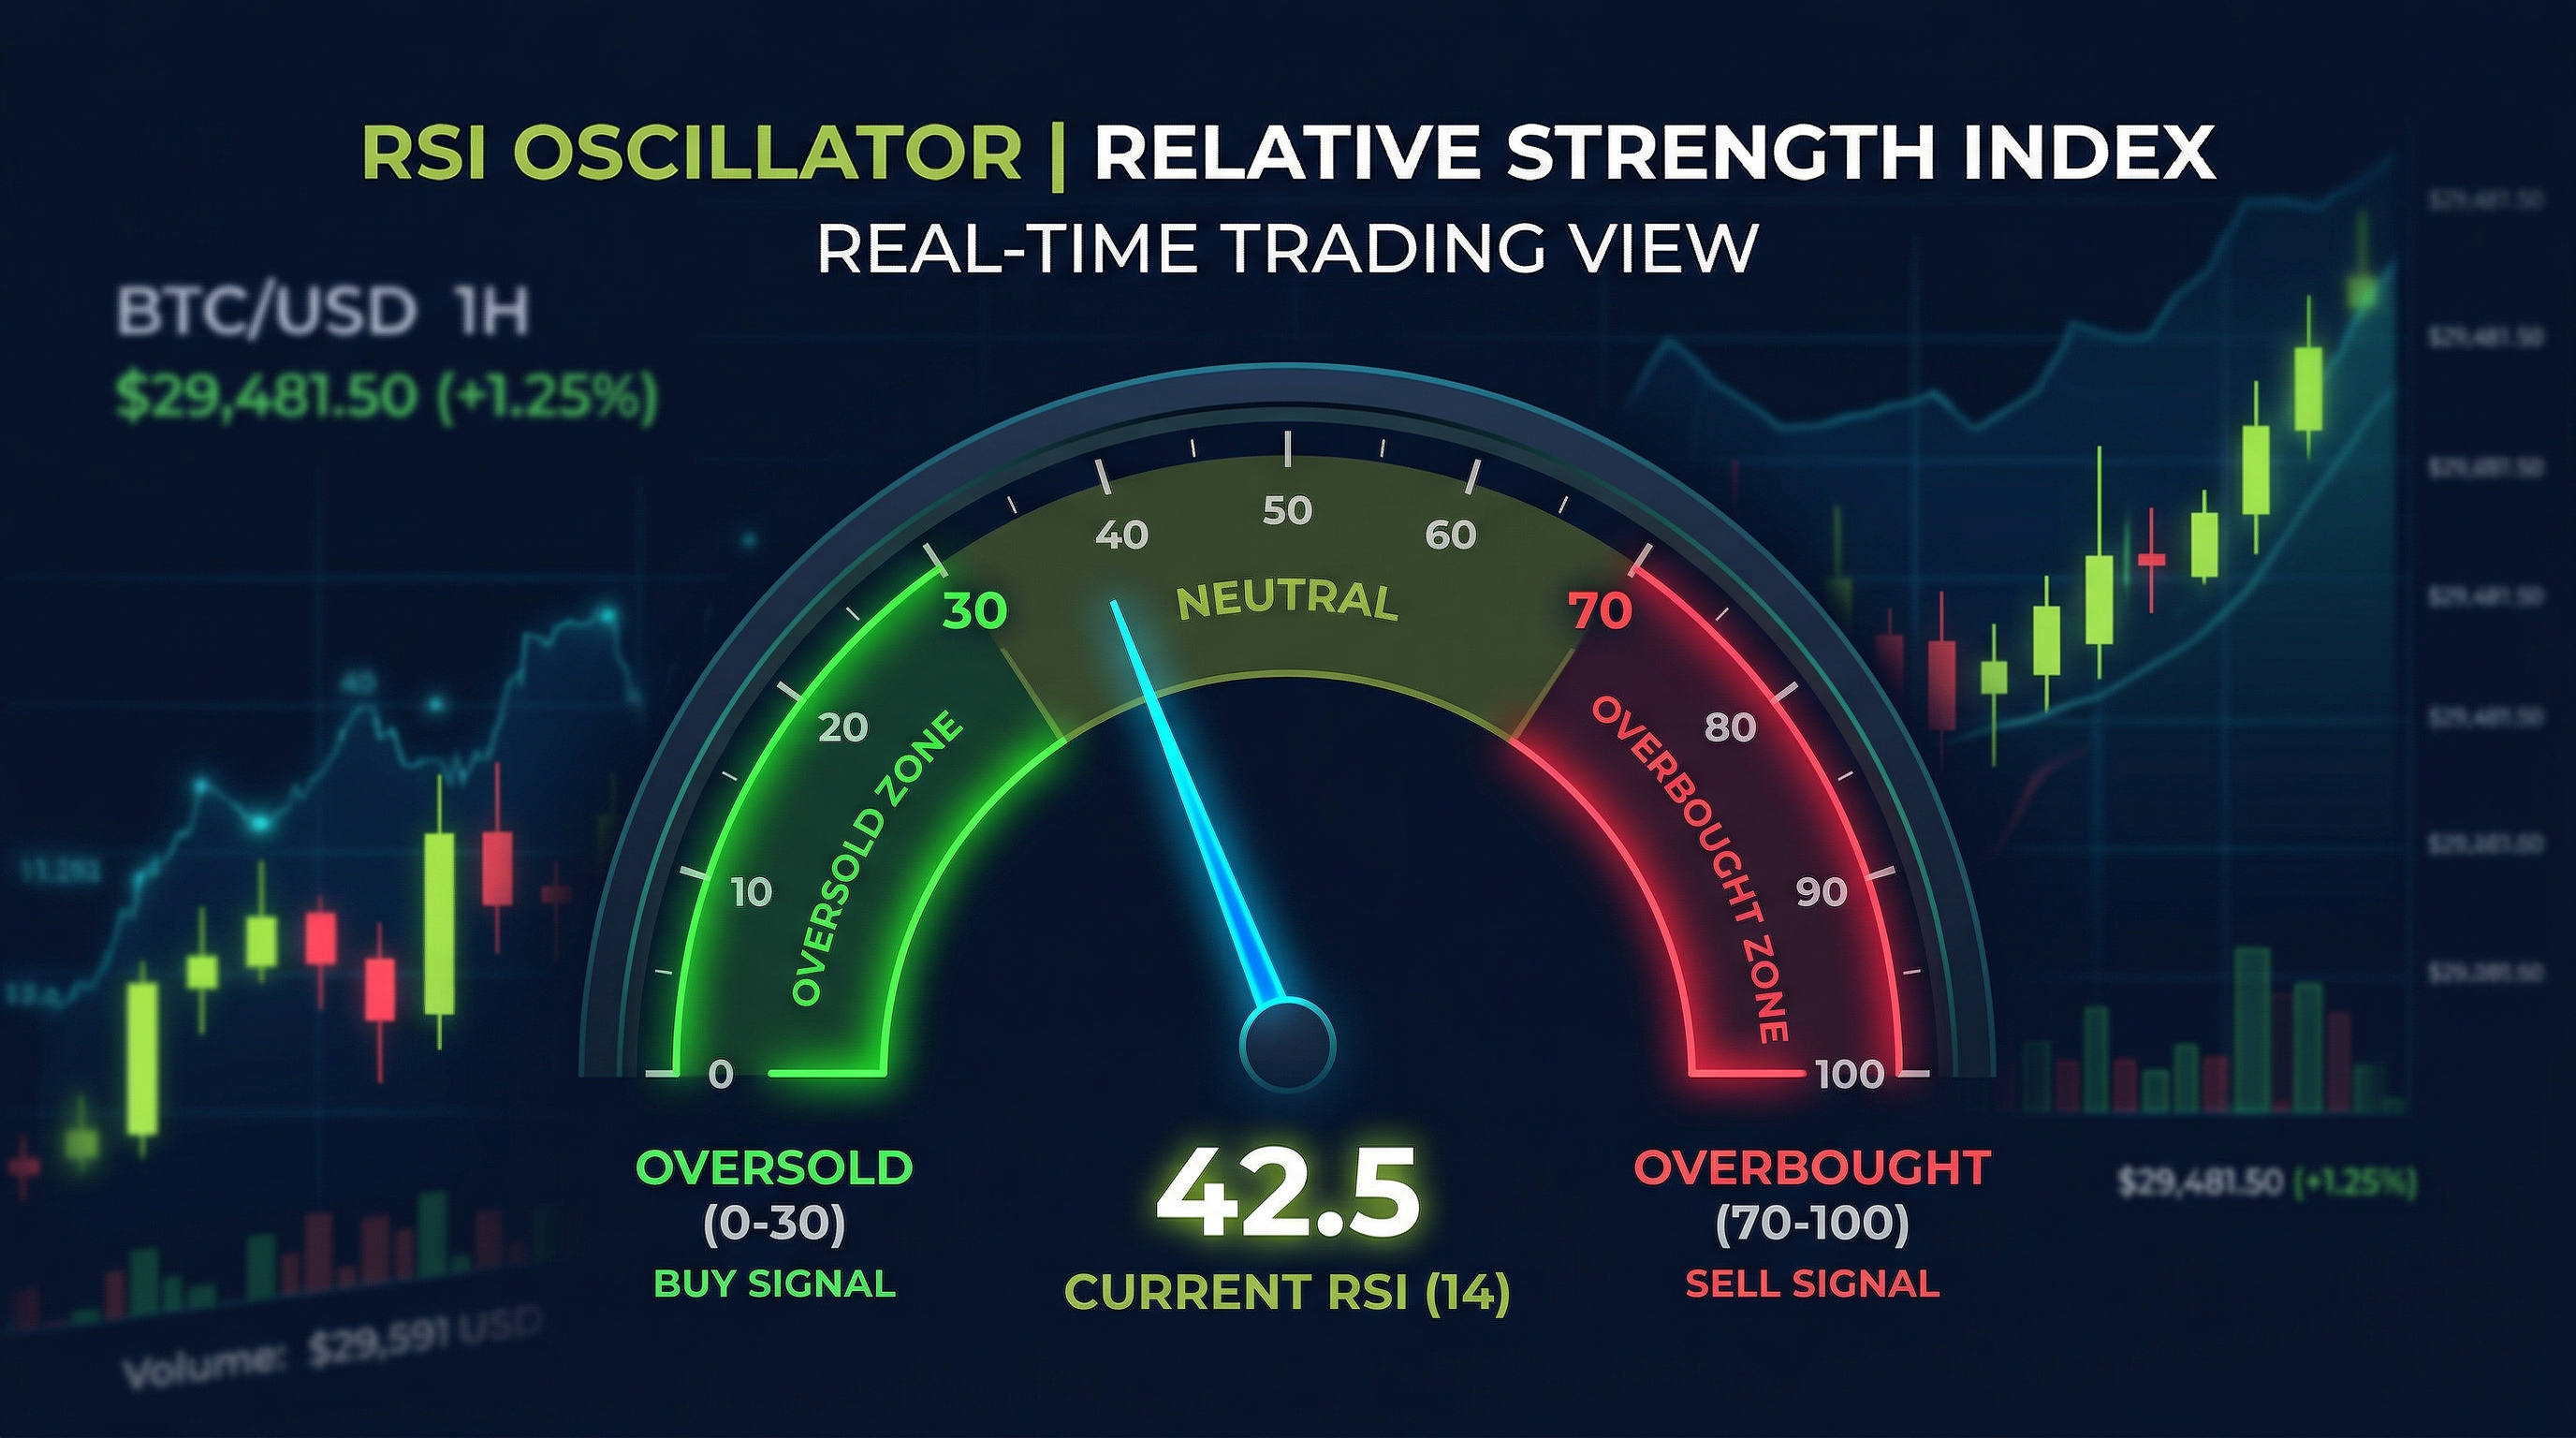
El RSI se mueve en una escala del 0 al 100. La interpretación tradicional:
- Por encima de 70: Potencialmente sobrecomprado (la acción ha subido rápido, puede estar lista para un retroceso)
- Por debajo de 30: Potencialmente sobrevendido (la acción ha caído rápido, puede estar lista para un rebote)
- 50: El punto medio — frecuentemente actúa como nivel de soporte/resistencia para el propio indicador
El período predeterminado es 14 (usa los últimos 14 períodos). En un gráfico diario, eso son 14 días de trading.
Cómo Se Calcula Realmente el RSI
El RSI compara las ganancias promedio con las pérdidas promedio durante el período de referencia. Se calcula como: RSI = 100 − (100 / (1 + RS)), donde RS = Ganancia Promedio / Pérdida Promedio. Una acción que ha subido más de lo que ha bajado tendrá un RS alto y, por lo tanto, un RSI alto. No necesitas calcularlo manualmente — todas las plataformas de gráficos lo hacen automáticamente — pero entender la matemática te ayuda a comprender por qué el indicador se comporta como lo hace.
El Mayor Malentendido del RSI: Sobrecomprado ≠ Vender
Esta es la sección más importante de todo este artículo. En acciones con tendencia fuerte, el RSI puede mantenerse por encima de 70 durante semanas o incluso meses. Durante una subida alcista genuina, que el RSI se mantenga elevado es una señal de fortaleza, no de una reversión inminente. Muchas de las mejores operaciones de momentum ocurren cuando el RSI está por encima de 70 y sube.
Piensa en el RSI por encima de 70 como una señal de precaución, no una señal de stop. Te indica que la acción se ha movido rápido y que una consolidación o retroceso es más probable de lo habitual. No te dice que la tendencia haya terminado.
Cuándo el Sobrevendido Funciona Realmente Como Señal de Compra
El RSI por debajo de 30 funciona mejor como señal de compra en acciones con fundamentos sólidos y en tendencias alcistas generales — donde la lectura de sobrevendido refleja un retroceso temporal, no el inicio de un colapso. En acciones genuinamente deterioradas (fundamentos en deterioro, tendencias sectoriales negativas), el RSI puede permanecer por debajo de 30 mucho tiempo mientras la acción sigue cayendo.
Nunca uses el RSI de forma aislada. Siempre combínalo con la dirección de la tendencia y el contexto del precio. RSI por debajo de 30 en una acción de calidad en tendencia alcista = configuración de compra de alta probabilidad. RSI por debajo de 30 en una acción en tendencia bajista con malos fundamentos = posible trampa de valor. La lectura del RSI es la misma; el contexto cambia completamente su significado. Practica la lectura del RSI en contexto usando gráficos reales en Traderise.
5 Formas de Usar el RSI que Realmente Funcionan
1. Divergencia del RSI (La Señal Más Poderosa)
La divergencia del RSI ocurre cuando el precio y el RSI se mueven en direcciones opuestas — y es una de las señales más confiables en el análisis técnico.
Divergencia alcista: El precio marca un nuevo mínimo, pero el RSI marca un mínimo más alto. El momentum mejora incluso cuando el precio cae. Esto suele preceder a una reversión al alza.
Divergencia bajista: El precio marca un nuevo máximo, pero el RSI marca un máximo más bajo. El momentum se debilita incluso cuando el precio sube. Esto suele preceder a una reversión a la baja — como lo que me habría salvado de ese desastroso corto en tecnología que mencioné.
2. La Línea 50 del RSI como Filtro de Tendencia
Cuando el RSI está por encima de 50 y con pendiente ascendente, la acción tiene momentum alcista. Por debajo de 50 y con pendiente descendente = momentum bajista. Usar el RSI 50 como filtro de tendencia es simple pero sorprendentemente efectivo. Solo compra acciones donde el RSI esté por encima de 50 (confirmando momentum al alza) y vende o ponte corto en acciones donde el RSI esté por debajo de 50.
3. Sobrecomprado/Sobrevendido en Mercados Laterales
En mercados laterales sin tendencia, las señales clásicas de sobrecomprado/sobrevendido funcionan mejor. Cuando una acción ha estado oscilando entre $45–$55 durante meses, el RSI llegando a 75 cerca del techo de $55 es una señal de venta genuina. El RSI llegando a 28 cerca del piso de $45 es una señal de compra genuina. La clave es confirmar que la acción realmente está en rango (usa Bandas de Bollinger o análisis de volumen para verificarlo).
4. El RSI como Confirmación de Momentum
Usa el RSI para confirmar rupturas. Si una acción rompe a un nuevo máximo de 52 semanas Y el RSI está por encima de 60–70, la ruptura tiene momentum detrás. Si una acción rompe a un nuevo máximo mientras el RSI está bajando o por debajo de 50, la ruptura probablemente es débil y propensa a fallar.
5. Ajustar la Configuración del RSI para Diferentes Marcos Temporales
Para day trading: períodos más cortos (7–9) hacen el RSI más sensible y generan más señales. Para swing trading: el período estándar de 14 funciona bien. Para trading de posición: períodos más largos (21–25) reducen el ruido y muestran solo cambios de momentum significativos. Experimenta con configuraciones en las herramientas de gráficos de Traderise en operaciones de paper trading para ver qué período se adapta a tu estilo.
Practica Esta Estrategia Sin Riesgo
Traderise te permite operar en paper trading con $10,000 en fondos virtuales usando datos reales del mercado. Prueba cada estrategia de este artículo antes de arriesgar un solo dólar real.
Empieza a Operar en Paper Trading GratisRSI + Otros Indicadores: Mejor Juntos
El RSI es más poderoso cuando se combina con otros indicadores. Aquí hay tres combinaciones potentes:
RSI + Medias Móviles: Usa las medias móviles para la dirección de la tendencia y el RSI para el momento de entrada. Compra cuando: la acción está por encima de la MA de 50 días (tendencia alcista) Y el RSI retrocede a 40–50 (momentum enfriándose pero no roto). Esto captura entradas en retrocesos dentro de tendencias alcistas confirmadas.
RSI + Volumen: Cuando el RSI da una lectura de sobrevendido y el volumen sube drásticamente, la probabilidad de un rebote es mucho mayor. Gran volumen en soporte con RSI sobrevendido = señal de acumulación institucional.
RSI + Patrones de Velas: Cuando el RSI muestra condiciones de sobrevendido Y se forma un patrón de reversión alcista en velas (martillo, envolvente), tienes dos fuentes de confirmación separadas apuntando a la misma conclusión. La convicción en la operación aumenta.
Cambiar el Período del RSI: Cómo Se Ve 7 vs 14 vs 21 en la Práctica
RSI 7 (período corto): Más sensible, más señales, más falsos positivos. Útil para day trading o cuando quieres capturar cambios de momentum rápidos.
RSI 14 (predeterminado): El punto óptimo para la mayoría de los swing traders. Equilibrio entre sensibilidad y confiabilidad.
RSI 21 (período más largo): Más suave, menos señales, mayor calidad cuando ocurren. Mejor para operadores de posición que solo quieren operar las configuraciones de mayor convicción.
No existe un período universalmente correcto — solo el período que se adapta a tu marco temporal y estilo de trading. Prueba cada uno en datos históricos para ver cuál genera las mejores señales para la forma en que operas. La plataforma de paper trading de Traderise te permite ejecutar estas pruebas en gráficos históricos reales sin arriesgar capital.
Domina el RSI en Gráficos Reales del Mercado
Practica identificar divergencias del RSI, rebotes desde sobrevendido y confirmación de momentum en acciones reales con las herramientas de gráficos de Traderise — y opera en paper trading las configuraciones antes de ir en vivo.
Prueba Traderise Gratis