Solía mirar los gráficos y ver solo el precio. Una línea que sube, una línea que baja, patrones formándose. El día que aprendí a leer el volumen — las barras en la parte inferior de cada gráfico que había ignorado durante meses — mi análisis cambió fundamentalmente. El precio te dice qué ocurrió. El volumen te dice si debes creerlo.
Los operadores profesionales consideran el volumen uno de los factores más importantes en cualquier gráfico. Aquí está por qué, y cómo usarlo de forma práctica.
Qué Es el Volumen y Por Qué Es el Detector de Mentiras del Mercado
El volumen es simplemente el número de acciones (o contratos) negociadas durante un período determinado. Cada barra en tu gráfico tiene una barra de volumen correspondiente que muestra cuánta actividad ocurrió durante el período temporal de esa vela.
El volumen representa convicción. Alto volumen en un movimiento significa que muchos participantes coincidieron en transaccionar a ese precio — el movimiento tiene amplio respaldo. Bajo volumen en un movimiento significa que pocos participantes se involucraron — el movimiento puede no reflejar el sentimiento real del mercado y es más probable que se revierta.
El Principio Central del Volumen
El volumen debe confirmar el precio. En una tendencia alcista saludable, los días alcistas (velas verdes) deben tener mayor volumen que los días bajistas (velas rojas). Cuando ves lo contrario — mayor volumen en días bajistas que en días alcistas — la presión vendedora está creciendo aunque el precio no haya caído dramáticamente todavía. Esa divergencia es una señal de advertencia temprana.
5 Patrones de Volumen que Todo Operador Debe Conocer
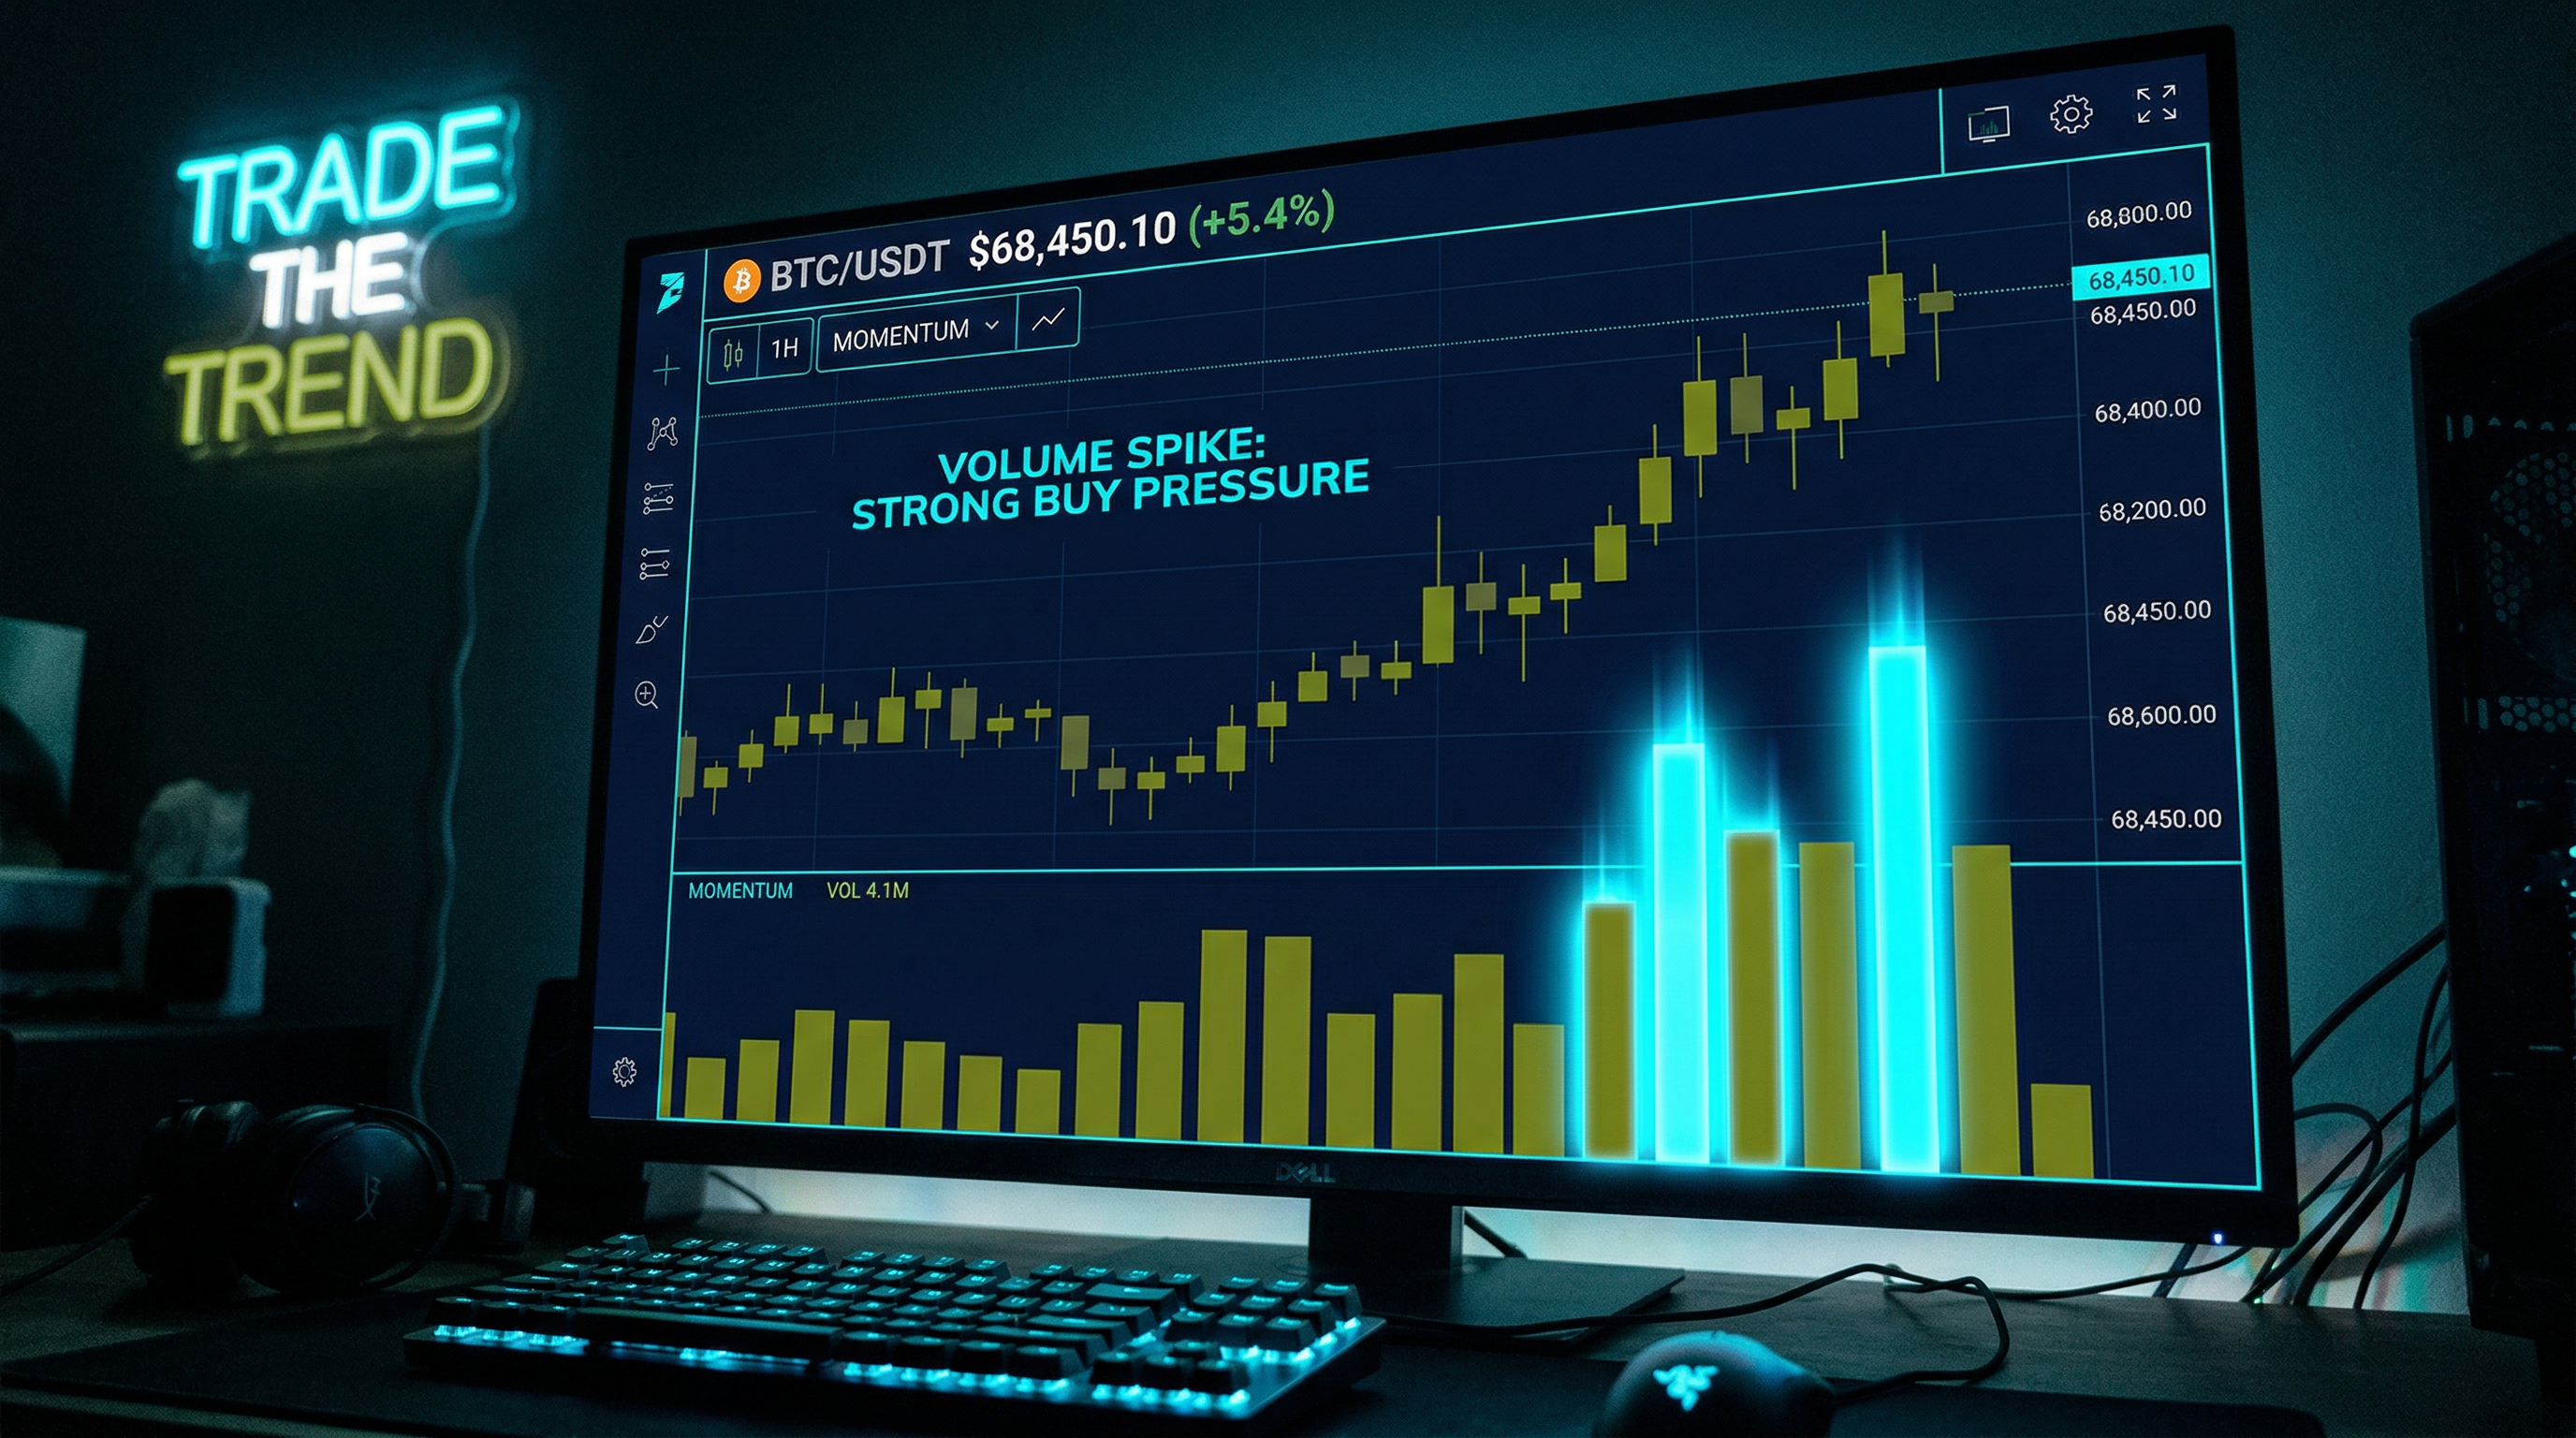
Patrón 1: Expansión de Volumen en la Ruptura
La señal de volumen más importante: cuando una acción rompe por encima de un nivel de resistencia significativo con un volumen 1.5x–2x o más por encima del promedio, es probable que la ruptura se sostenga. Las instituciones están comprando; el movimiento tiene respaldo real. Cuando una ruptura ocurre con volumen por debajo del promedio, es sospechosa — a menudo una falsa ruptura o «fakeout» que revierte rápidamente.
Este único filtro — operar solo rupturas con fuerte confirmación de volumen — mejora dramáticamente las tasas de éxito de las operaciones de ruptura para principiantes. Establece alertas de volumen en Traderise para ser notificado cuando una acción en tu lista de seguimiento se dispare con volumen inusual.
Patrón 2: Volumen Climático (Agotamiento)
A veces una acción sube con volumen creciente durante días o semanas, luego de repente abre con gap al alza con volumen extremo — 3–5x el promedio o más — antes de revertirse bruscamente. Esto es «compra climática»: los últimos compradores desesperados acumulándose, frecuentemente atrapando a los rezagados justo antes de que el movimiento se agote. El volumen climático en un techo es una señal de corto de alta calidad. El mismo patrón invertido (venta climática en un mínimo) puede señalar un piso y reversión.
Patrón 3: Sequía (Contracción de Volumen)
Cuando una acción consolida lateralmente y el volumen disminuye gradualmente a niveles muy bajos, está construyendo energía. Esta «sequía» de volumen frecuentemente precede a movimientos explosivos a medida que la acción se comprime antes de romper. Una acción consolidando silenciosamente con muy bajo volumen que luego repentinamente sube con volumen masivo es una de las configuraciones más limpias en el análisis técnico — el «VCP» (Volatility Contraction Pattern) popularizado por Mark Minervini.
Patrón 4: Alto Volumen en Retrocesos Dentro de Tendencias Alcistas
Cuando una acción en tendencia alcista retrocede, quieres ver que el retroceso ocurra con volumen decreciente. Esto significa que la venta no es particularmente agresiva — los alcistas simplemente están tomando un respiro. Si un retroceso ocurre con volumen creciente, sugiere una venta más agresiva, y es menos probable que los niveles de soporte se mantengan.
Patrón 5: Divergencia de Volumen
La acción marca un nuevo máximo de precio, pero el volumen es menor que en el máximo anterior. Esta es la divergencia de volumen bajista — el movimiento hacia nuevos máximos tiene menos participación que antes. No significa vender inmediatamente, pero es una señal de alerta que sugiere que la tendencia puede estar perdiendo fuerza.
Antes de confiar en cualquier señal de precio — ruptura, rebote en soporte, continuación de tendencia — pregúntate: «¿El volumen lo confirma?» Alto volumen = convicción. Bajo volumen = sospecha. Haz esto una parte no negociable de tu rutina de análisis. Puedes practicar la lectura del volumen en contexto en gráficos reales con las herramientas de gráficos de Traderise.
OBV (On-Balance Volume): El Indicador de Volumen que Lidera al Precio
El OBV (On-Balance Volume) es un indicador acumulativo que suma el volumen en los días alcistas y lo resta en los días bajistas. La línea resultante muestra el flujo general de dinero hacia o desde una acción a lo largo del tiempo.
La percepción clave: el OBV frecuentemente tiene tendencia antes que el precio. Cuando el OBV empieza a subir mientras el precio todavía está plano o cayendo, señala acumulación institucional — el dinero inteligente está comprando silenciosamente mientras los inversores minoristas están vendiendo o manteniéndose al margen. Esta es una de las señales de adelanto más valiosas en el análisis técnico.
Usando el OBV en la Práctica
Busca rupturas del OBV. Cuando el OBV rompe a un nuevo máximo antes de que lo haga el precio, frecuentemente sigue una ruptura de precio. Cuando el OBV diverge del precio (precio subiendo, OBV cayendo), está ocurriendo distribución — el dinero inteligente está vendiendo en el rally. Estas señales te dan advertencia anticipada de movimientos inminentes.
Practica Esta Estrategia Sin Riesgo
Traderise te permite operar en paper trading con $10,000 en fondos virtuales usando datos reales del mercado. Prueba cada estrategia de este artículo antes de arriesgar un solo dólar real.
Empieza a Operar en Paper Trading GratisVolumen Relativo al Promedio: Cómo Interpretar los Números
Los números de volumen brutos no significan mucho sin contexto. Una acción operando 2 millones de acciones suena alto hasta que aprendes que normalmente opera 10 millones de acciones por día. El contexto lo es todo. Siempre mira el volumen en relación con el promedio de la acción.
La mayoría de las plataformas de gráficos muestran una línea horizontal en las barras de volumen que representa el volumen promedio. Reglas generales rápidas:
- Por debajo de 0.5x el promedio: Volumen muy ligero — trata todos los movimientos de precio con escepticismo
- 0.5x–1.5x el promedio: Rango normal — negocio habitual
- 1.5x–3x el promedio: Notable — convicción significativa detrás del movimiento
- 3x–5x el promedio: Probable actividad institucional significativa
- 5x+ el promedio: Evento importante — noticias, ganancias, posible clímax
Errores Comunes en el Análisis de Volumen
Ignorar el volumen sectorial y del mercado en general: En ventas masivas del mercado amplio, el volumen sube en todas las acciones simultáneamente. Un pico de volumen en tu acción durante un día de caída del mercado no necesariamente significa venta específica de esa acción — verifica primero el volumen general del mercado.
Sobre-indexar en picos únicos de volumen: Un día de volumen inusual no siempre es significativo. Busca patrones de volumen creciente o decreciente durante múltiples días para señales más confiables.
Ignorar el volumen en after-hours y pre-apertura: Para day traders, el volumen en pre-apertura y la actividad de gap frecuentemente es más informativa que el volumen en horario regular. Revisa el panorama completo.
El análisis de volumen recompensa a los practicantes pacientes. Comienza simplemente verificando si el volumen confirma tus próximas 20 operaciones basadas en precio en la plataforma de paper trading de Traderise. Rápidamente desarrollarás intuición para cómo se ve y se siente el «volumen confirmador» versus los movimientos sospechosos y delgados.
Aprende a Leer el Volumen en Gráficos Reales
Practica el análisis de patrones de volumen en acciones reales con las herramientas de gráficos y paper trading de Traderise. Tu filtro de volumen mejorará inmediatamente tu tasa de éxito en operaciones.
Prueba Traderise Gratis